Intention
There are many branches of visual practice developing rapidly, from graphic facilitation, to graphic recording, to sketchnoting, to generative graphics. In the prior two sessions we explored potential axis for display and metaphors that might help us visualize and provide further definition to the field. Mathias and David chose the archipelago metaphor and worked on it during the EuViz conference. In the final keynote the big map was presented and David facilitated the entire audience indicating where they were participating in various communities of practice, depicted as islands. We will share this final version and continue our exploration on line. Here is a small cutout from the map to give you a taste.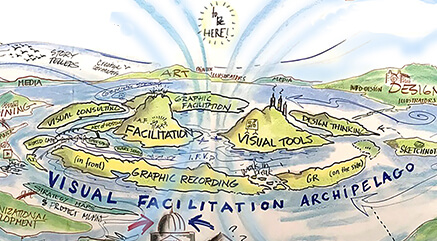
Key Questions for Exploration
- What are the meaningful axes of development?
- What are the predominant practice areas?
- Can we estimate the scale of different practice areas?
- Are there identifiable thought leaders?
- Who else is tracking this field?
Exchange Design
Agenda: Session #3 9:00 AM • Welcome, review of the purpose: Reporting on EuViz 2018 and latest Map version • Introductory go-around—What services names do you use in your practice—i.e. Graphic Facilitator, Information Designer, Consultant? • Mathias Weitbrecht and David Sibbet share their story of presenting at EuViZ 9:50 AM • Break • Review the map presented in Denmark. Make suggestions for further refinement. Dialogue for insights. • Takeaways 11:00 AM • Adjourn- June 25th / Mapping the Field of Visual Practice Session 1
- July 11th / Mapping the Field of Visual Practice Session 2
- August 21st / Mapping the Field of Visual Practice Session 3
Details
DATE: June 25, 2018 / July 11, 2018 / August 21, 2018
TIME: 9:00 am - 11:00 am PACIFIC
ACCESS: OPEN TO THE PUBLIC/FEE; MEMBERS/NO FEE WITH CODE
VENUE OR PLATFORM: Zoom.us
PRICE: $50